Integrating Geospatial Data Into your Decision Making
“The world’s most valuable resource is no longer oil, but data.” —The Economist
This mantra has been around for the past few years. Most organizations use a variety of data to inform their business decisions. Financial data is used to analyze the market, data on clients provides an overview of consumers, etc. One particular type of data that could considerably benefit your business is geospatial data. In most cases, decision makers have no training in geomatics or any related discipline. Geospatial data therefore has to be easy to understand and use. That is where we geomaticians come in. Our role is to manipulate data and integrate it in such a way that everyone can use it. Your entire organization will profit from it. Here’s a simple example of how geospatial data can be used in a market analysis:
Brûlerie CaféCafé (registered trademark), a local coffee shop, is at a loss as to why its competitor (located two blocks away) is so much busier—especially considering that Brûlerie CaféCafé’s coffee is not only better, but also a bit less expensive. First, we could analyze customers’ consumption patterns and socio economic status (women vs. men, students vs. professionals, etc.). Armed with an overview of the clientele, we could now develop a more targeted marketing strategy to attract more customers. Say that, after a few months, we notice the number of customers has barely increased. There has to be another explanation as to why the competition has more customers. What if we analyze the number of pedestrians that walk through our coffee shop’s intersection every day? It’s much easier for commuters to grab a coffee when they’re walking than when they’re driving. Our analysis will use traffic light count data, available on the Ville de Montréal website (in French only). We can then use FME to develop a workspace to prepare and view the data. Here is what the process looks like:
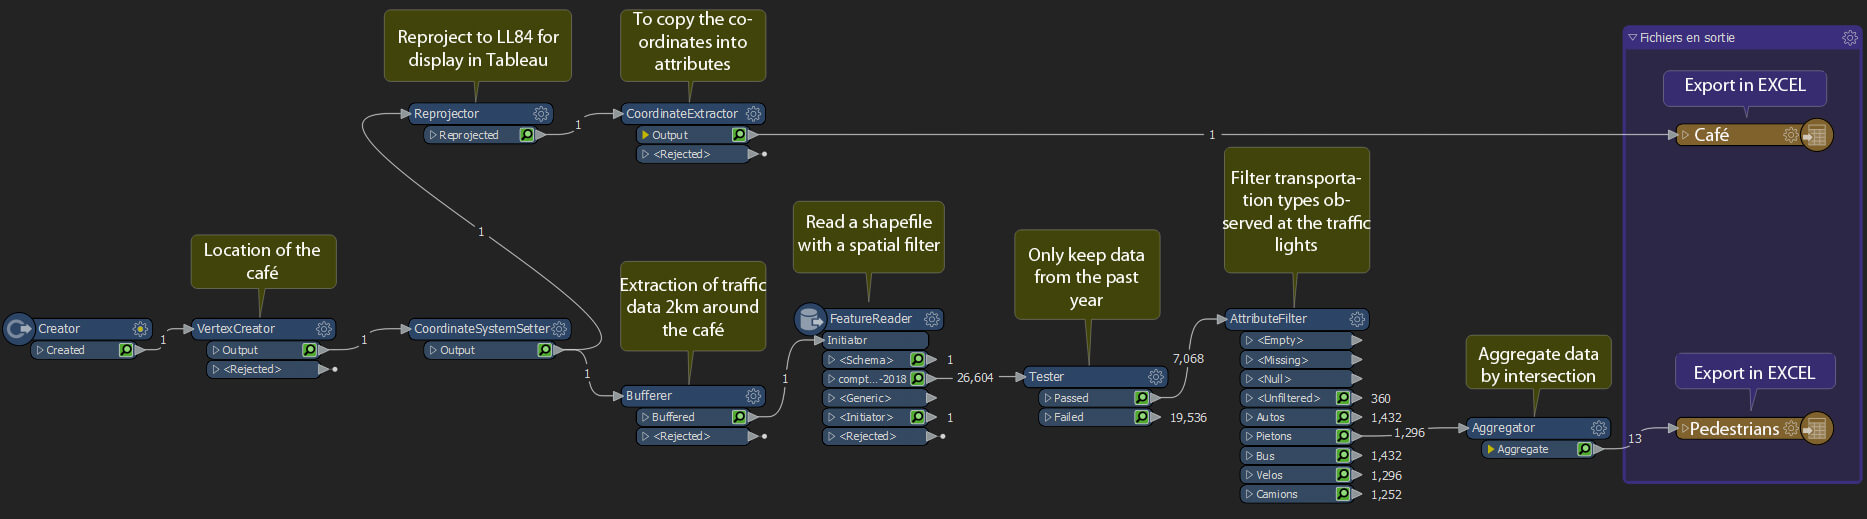
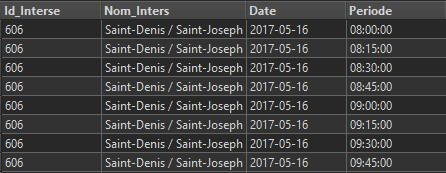
Let’s go over this workspace. First, we create a point representing the coffee shop’s location (our point of interest). We can read the street corner traffic data, we create a buffer zone around the location of the coffee shop. With FeatureReader and the buffer zone, we are able to read only the data within the zone of interest. This comes in handy when there is no need to read all the data available. In this case, the data covers the entire city of Montréal, which represents over 800,000 points! With this method, we are down to just over 26,000 points, which makes further processing that much quicker. After the data is read, we make sure to select only the most recent data. Because we are only interested in pedestrians, we use AttributeFilter to filter out the other modes of transportation. The last step before exporting the data is to aggregate traffic data. The data we use is acquired every 15 minutes at the different intersections. We then use Aggregator with a group from the “Id_Interse” (attribute of the intersection identifier) column. By counting the number of registrations for each intersection, we determine the number of pedestrians per intersection. Finally, we export the data in the format of our choice (here, we used Excel).
* Note: This method produces approximate results.
The data is now ready to be viewed. Here is a result that is stripped down, but speaks volumes (the circles show the rush hour pedestrian count for each intersection):
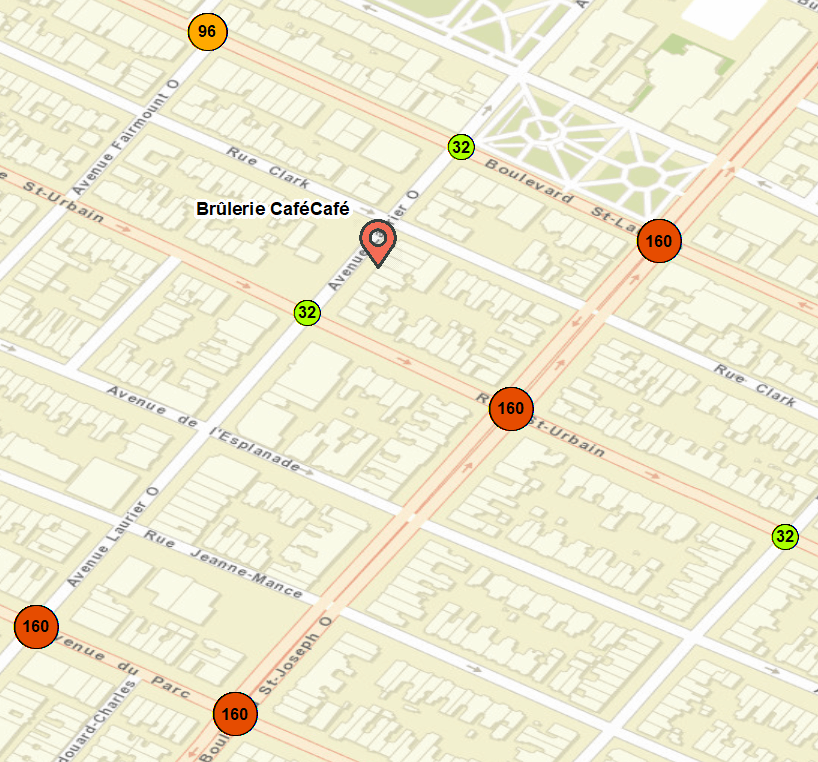
It should be noted that we do not have information on the number of pedestrians for the entire study area—only for major intersections. In this example, we can see that the coffee shop is located on an axis (Laurier Avenue) with lower pedestrian traffic. We can also see that pedestrian traffic is heavier one block down, on the Saint Joseph axis. For the coffee shop’s next location, it would be wise to choose a spot with a lot of foot traffic. We also could have carried out a multi criteria analysis based on weight. For instance, since pedestrians are more likely to stop for a coffee than cyclists, pedestrians will be assigned a greater weight (score) than cyclists. Another possibility would have been an in-depth analysis of the coffee shop’s proximity to a parking lot, which could have taken drivers into account as well. FME makes it easy to integrate different kinds of information from a variety of sources and to develop our geomarketing algorithm.
This simple scenario demonstrates the many ways in which your organization can benefit from geospatial information. Here are some other ideas: choosing the location of the next police station (based on the size of the area covered by existing stations), following up on your field teams in real time to better coordinate their work, deciding on the location of a new communications tower, etc.
Geospatial data is a real treasure chest of information, for public and private businesses alike.
Do you want to take advantage of your geospatial data?